Back to Work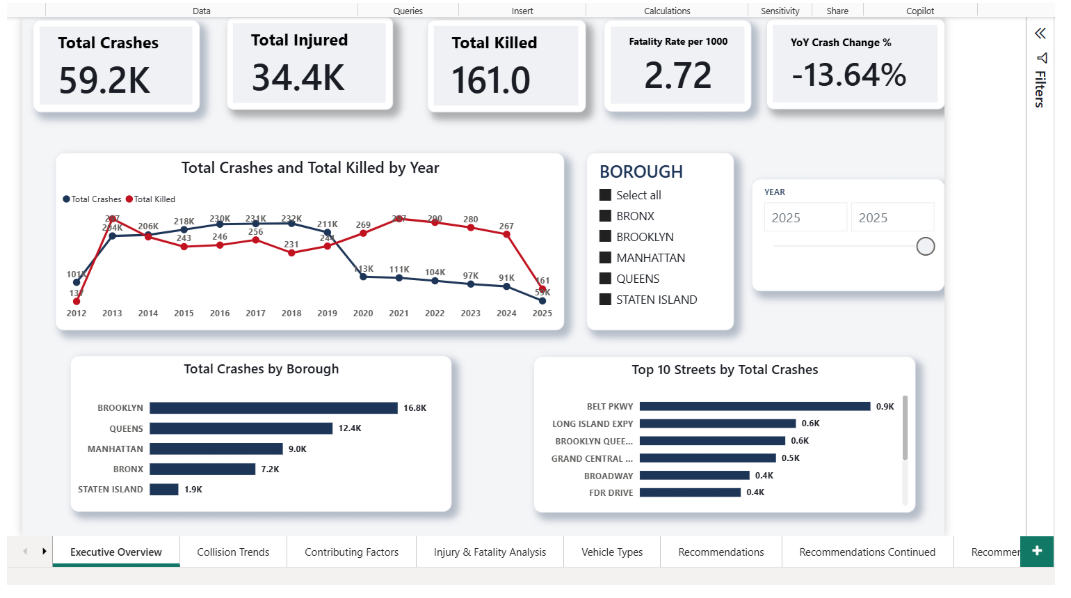
NYC Motor Vehicle Collisions Analysis (2012–2025)
Overview
An end-to-end data analytics project on 2.2M+ NYC motor vehicle collision records, covering data engineering (SQL Server), data cleaning (T-SQL), and business intelligence (Power BI). The project traces every crash citywide from July 2012 through September 2025, identifying trends, high-risk locations, contributing factors, and vulnerable road users — and translates the findings into concrete policy recommendations.
Tech stack: SQL Server · T-SQL · Power BI · Excel
The Pipeline
Raw NYC Open Data collision records are messy — null boroughs, inconsistent vehicle-type spellings, invalid coordinates, and up to 5 vehicles/contributing factors packed into wide columns per crash. This project took the data through a full pipeline:
Excel exploration → SQL Server ingestion → data profiling → cleaning & standardization → SQL analysis → Power BI dashboard
The 2.2M-row CSV was loaded into a staging table, profiled with T-SQL (null counts, duplicate checks, category distributions), then cleaned into a production table via a custom scalar function that collapsed 50+ inconsistent vehicle-type strings into ~20 clean categories. Two SQL views unpivoted the wide factor/vehicle columns into tidy long-format tables for analysis.
Key Findings
Collision Trends — Crashes climbed from ~101K (2012) to a peak of ~232K (2017), then fell sharply to ~59K by 2025. Brooklyn leads all boroughs with 489.6K total crashes, followed by Queens (409.8K) and Manhattan (339.0K).
Contributing Factors — Driver Inattention/Distraction is the #1 cause citywide by a wide margin (549,802 occurrences — 3.6x the #2 cause). Its share ranges from 28.77% in the Bronx to 34.00% in Queens.
Injury & Fatality — Pedestrians face a fatality rate of 1.30% per incident, roughly 3x higher than cyclists and nearly 5x higher than motorists, despite a smaller share of total injuries.
Vehicle Types — SUV/Station Wagon is involved in the most crashes overall (2.02M), but motorcycles have the highest fatality rate at 1.76 per 100 involvements — more than double the next-highest category.
Recommendations
- Citywide distracted-driving awareness campaigns, prioritized in Queens, Staten Island, and Manhattan
- Pedestrian & cyclist safety infrastructure, prioritized first in Brooklyn given its highest injury burden
- Targeted motorcycle safety enforcement given their outlier fatality rate
- Corridor-specific interventions split by road type (surface arterials vs. expressways/parkways)
How It Was Built
- Downloaded the Motor Vehicle Collisions – Crashes dataset from NYC Open Data
- Loaded the CSV into SQL Server via the Import Flat File wizard
- Profiled, cleaned, and standardized the data with T-SQL scripts and a custom function
- Built unpivoted views for factor/vehicle analysis
- Connected Power BI directly to SQL Server and built a 7-page interactive report