Works

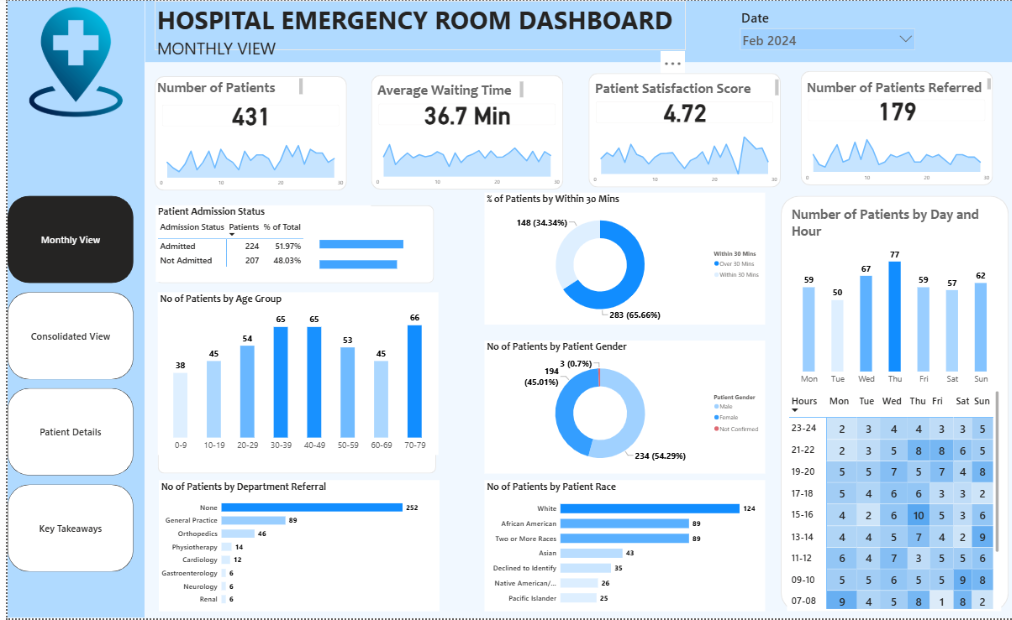
Hospital Emergency Room Dashboard

Interactive Power BI dashboard analyzing 19 months of ER activity (9,216 patient visits) — surfacing wait time issues, satisfaction trends, referral patterns, and staffing/peak-time insights for ER operations teams.

Read More
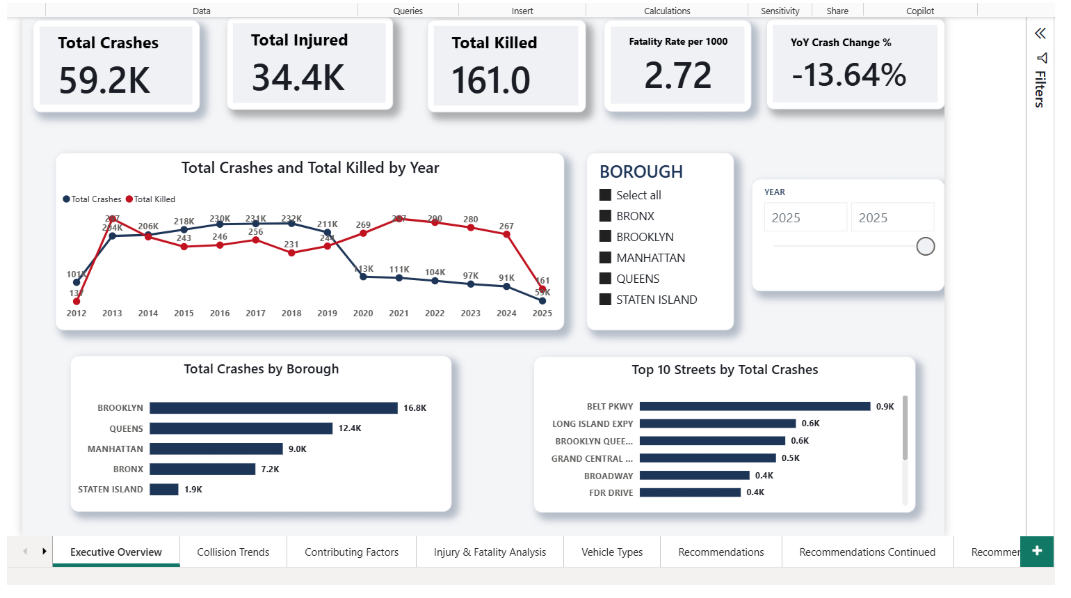
NYC Motor Vehicle Collisions Analysis (2012–2025)

End-to-end analysis of 2.2M+ NYC crash records (2012-2025) using SQL Server, T-SQL, and Power BI — cleaning messy raw data and building a 7-page interactive dashboard with policy recommendations on pedestrian safety, high-risk corridors, and vehicle-type risk.

Read More