Back to Work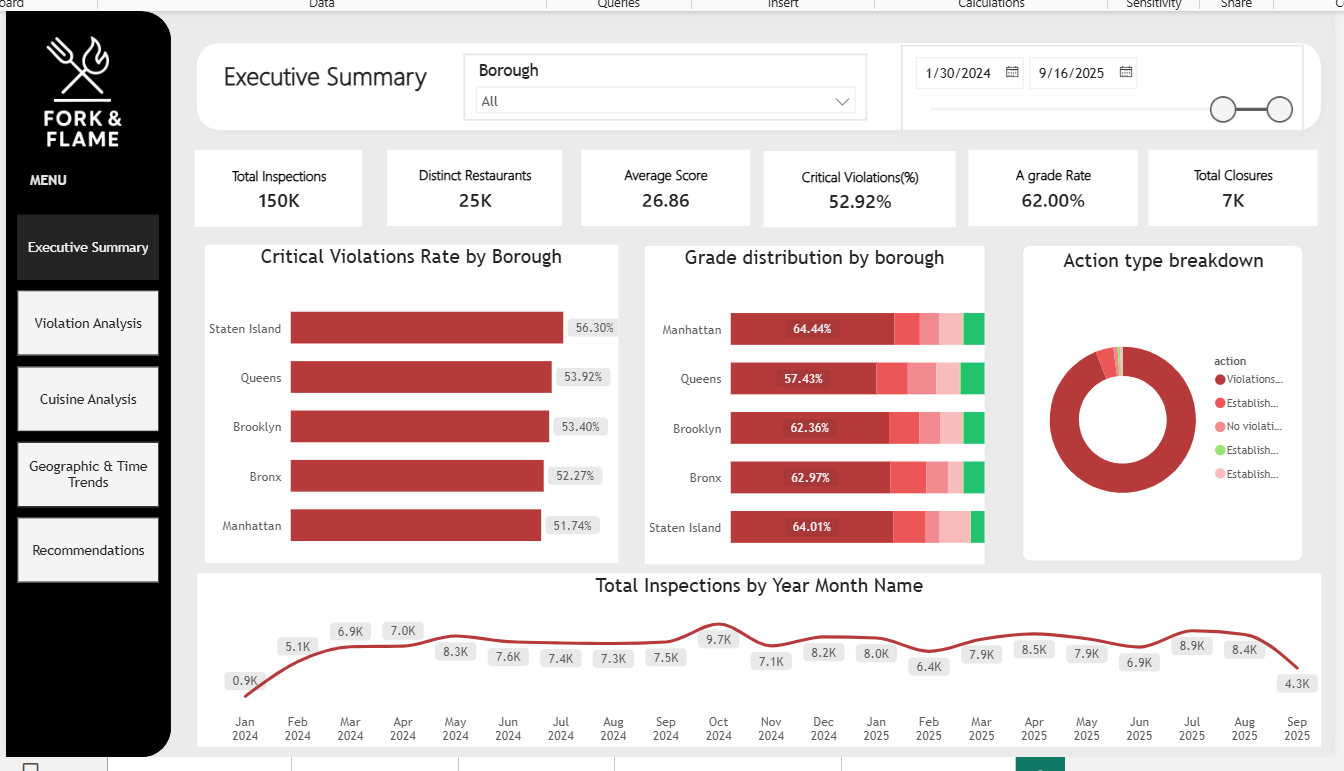
Fork & Flame — NYC Restaurant Health Inspection Analysis
An end-to-end data analytics project built on NYC DOHMH restaurant inspection data — from raw, messy CSV to a fully cleaned SQL Server database to an interactive Power BI report.
The brief: The Commissioner wants to understand which types of restaurants are struggling with food safety, which neighborhoods are at highest risk, and what violations are most common.
Working with ~289,000 raw inspection records, I explored the data in Excel, imported it into SQL Server via the Flat File Import Wizard (staging everything as NVARCHAR to avoid silent load errors), and diagnosed the mess column by column — inconsistent restaurant naming, mojibake text corruption, sentinel placeholder dates, and junk borough values.
From there I designed a typed production schema and wrote the T-SQL cleaning logic: standardizing restaurant names and cuisine categories, fixing encoding corruption, converting placeholder dates to true NULLs, and mapping junk borough values to "Unknown." All pattern-based text cleaning was rebuilt using nested REPLACE() chains since T-SQL has no REGEXP_REPLACE.
With clean data in place, I answered the Commissioner's brief directly in SQL — overall inspection insights, violation analysis, cuisine analysis (with a ≥100-inspection threshold to avoid small-sample bias), and geographic/time trends — before building a 5-page Power BI dashboard styled with a custom black/gold "Fork & Flame" theme: Executive Summary, Violation Analysis, Cuisine Analysis, Geographic & Time Trends, and Recommendations.
Key findings included a concentrated food-safety risk signal for Bangladeshi cuisine establishments (highest avg violation score and critical-violation rate among cuisines with reliable sample sizes), consistently strong performance from lower-complexity categories like donuts and hamburgers, and risk that clusters at the neighborhood (NTA) level rather than evenly across boroughs — leading to three targeted policy recommendations for DOHMH.
Tech stack: Excel, Microsoft SQL Server (SSMS), T-SQL, Power BI Desktop, DAX.